
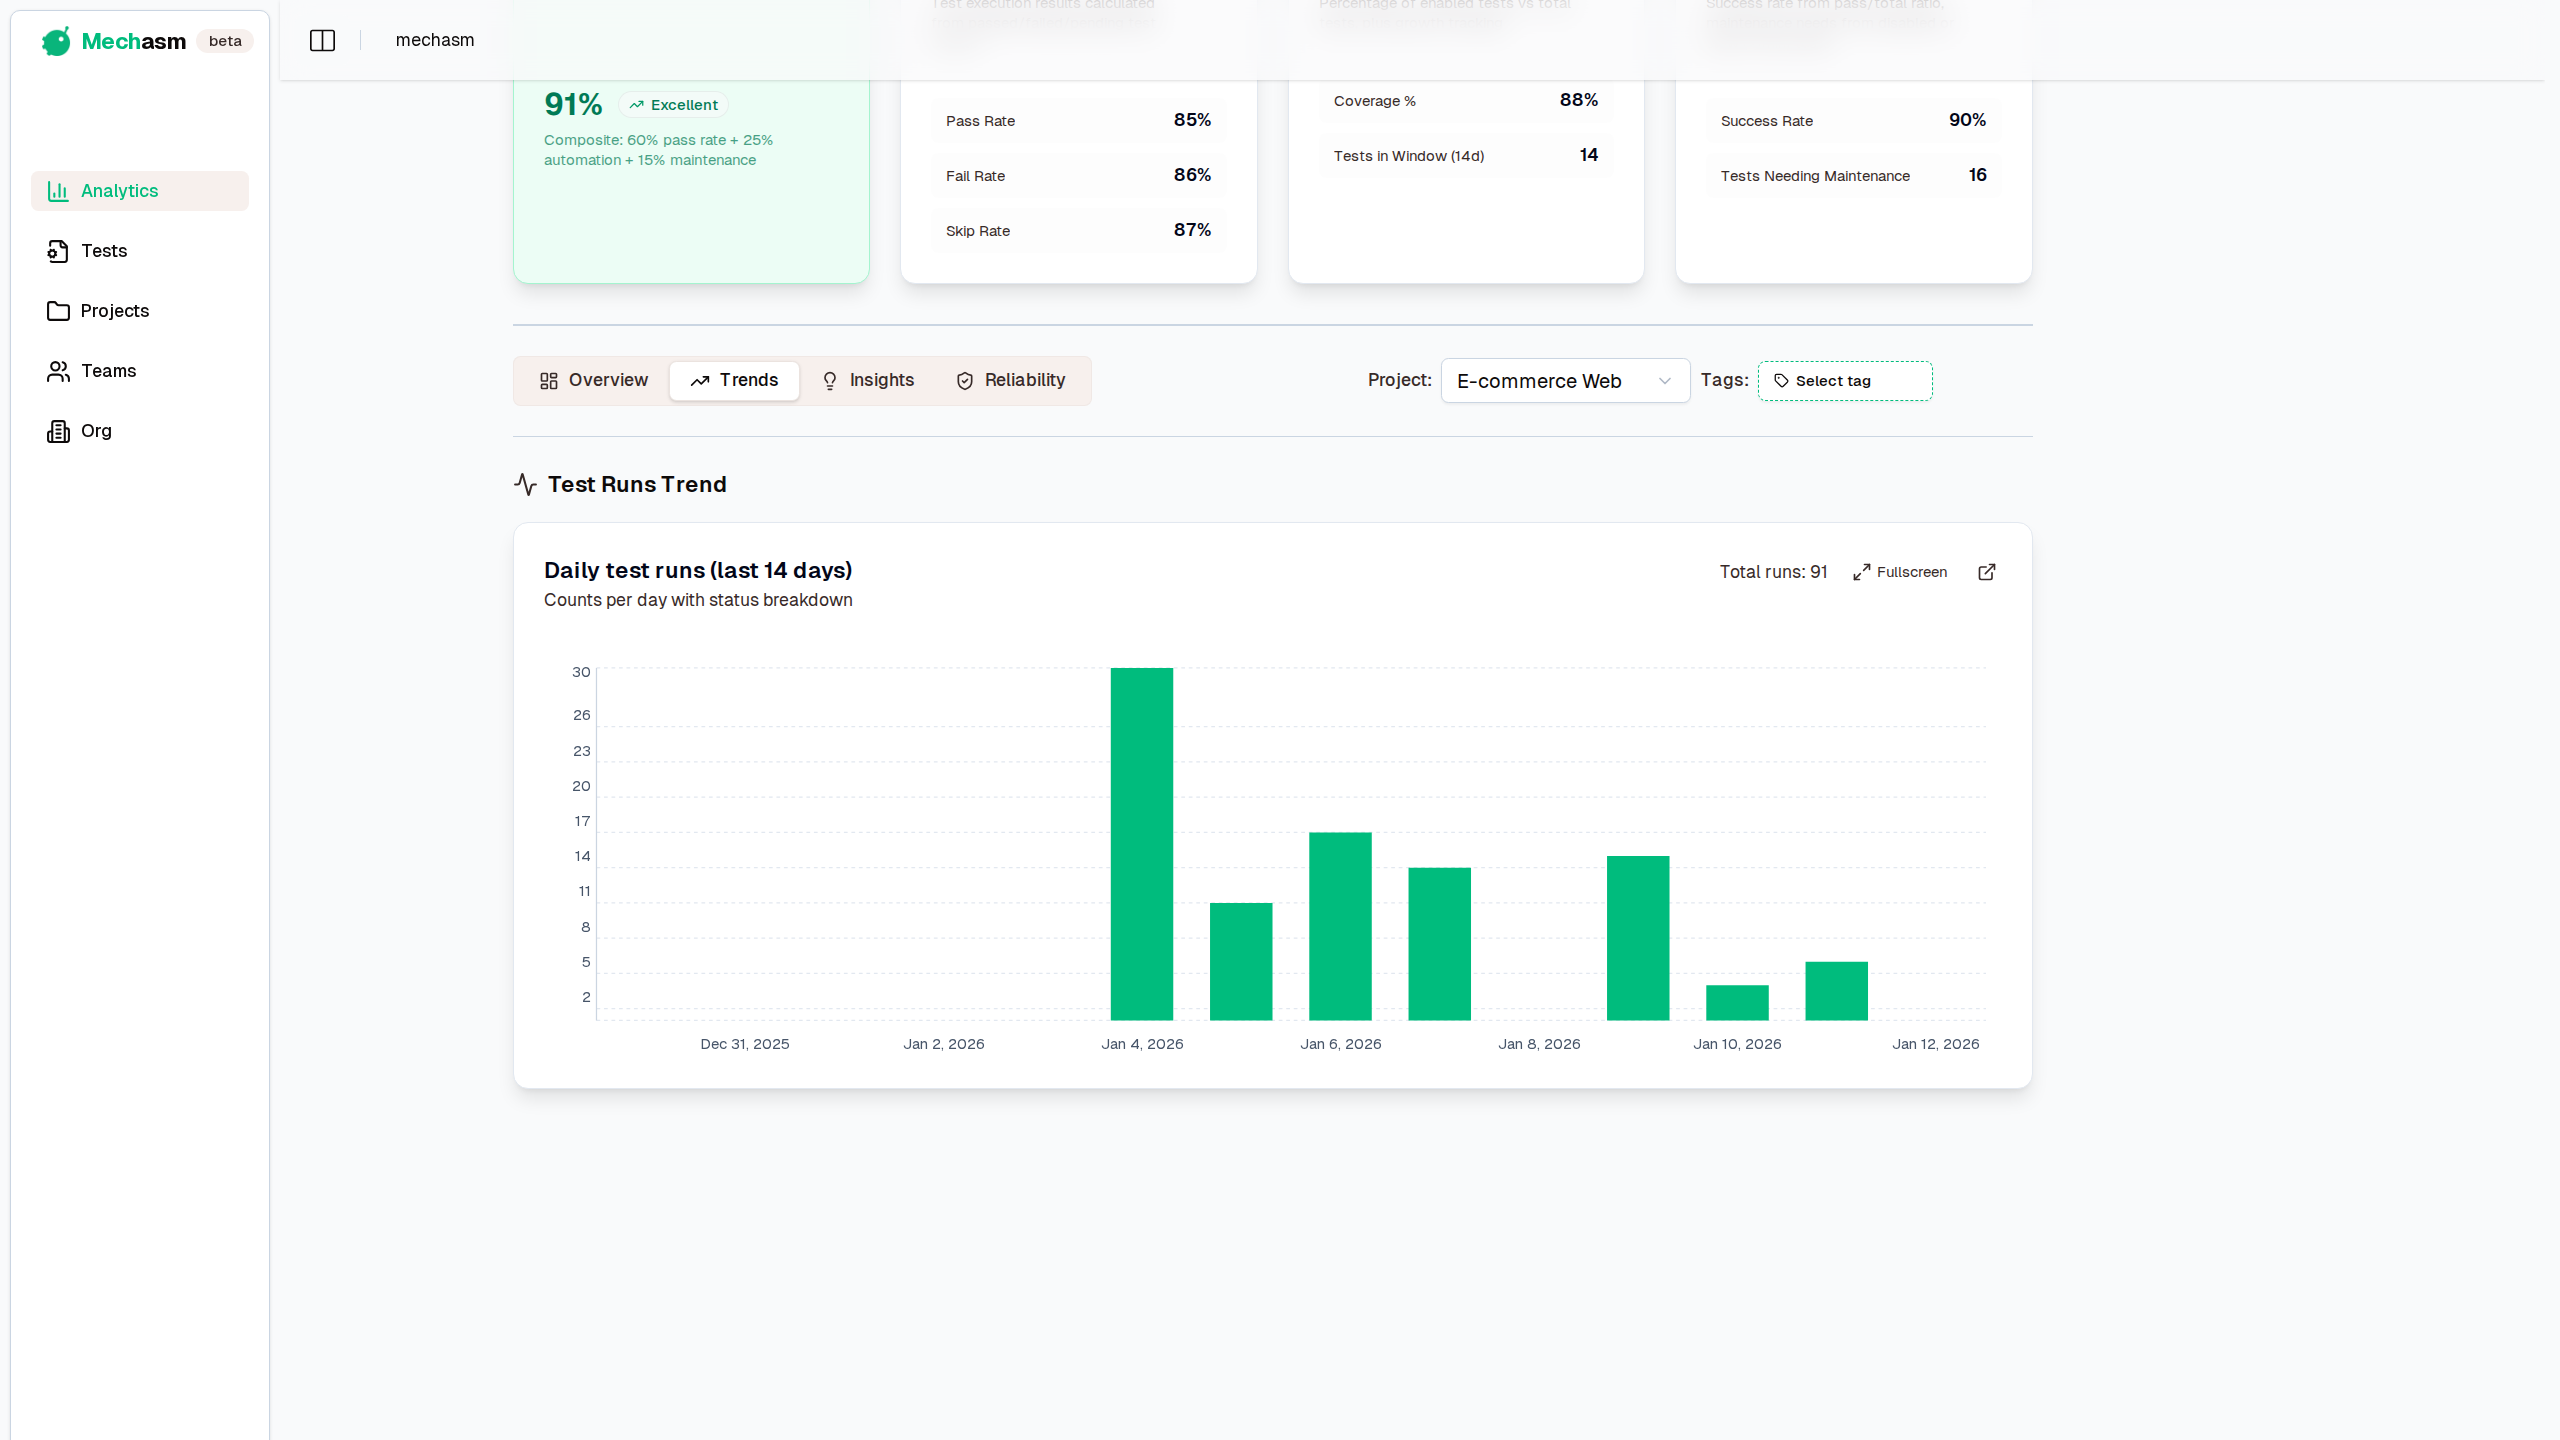
Track daily execution activity over the selected preset or custom date range (default 14 days). The chart shows the total number of test runs per day and a status breakdown (passed, failed, pending, running, regenerating). This reflects actual CI usage patterns and provides a clearer signal than update/create counts.
docs.mechasm.ai/analytics-trends.png
Scope
- Project-scoped: reflects the currently selected project
- Respects the Analytics page time window selector
Auto Refresh
The chart updates automatically when Auto Refresh is enabled.
- Options: Off, Every 1 min, Every 5 min
- Persistence: Your selection is saved in the browser (localStorage)
- Behavior: Avoids refetching when the tab is hidden to save resources
What it measures
- Total Runs: number of test runs created each day.
- Status Breakdown: counts per status (passed, failed, pending, running, regenerating) for that day.
Runs by Day
- X-axis: day (e.g., Aug 1, Aug 2)
- Y-axis: number of runs created on that day
- Total: sum across all days in the selected window
Use cases
- Monitor execution volume and stability over time
- Identify days with high failure rates
Runs Details Panel
- Click any day to flip the chart into a details view.
- The back panel summarizes total runs plus per-status counts with the same color palette.
- Below the summary, it lists every test that executed that day along with status frequencies (no artificial limit). Test names are resolved client-side from the tests dataset.
Data source
- Minimal run data is fetched for performance.
- Test names are resolved dynamically.
- Aggregation occurs client-side by day.
Considerations
- Logs and heavy fields are not fetched to reduce latency.
- Timezone is derived from the viewer’s browser when rendering the chart.
- Only runs within the selected time window are considered.
Interaction Model
- Desktop: click a data point/day to reveal the details panel; click the Back button to return to the chart.
- Mobile: tap to open the details panel; tap Back to return. Hover tooltips are no longer used.