
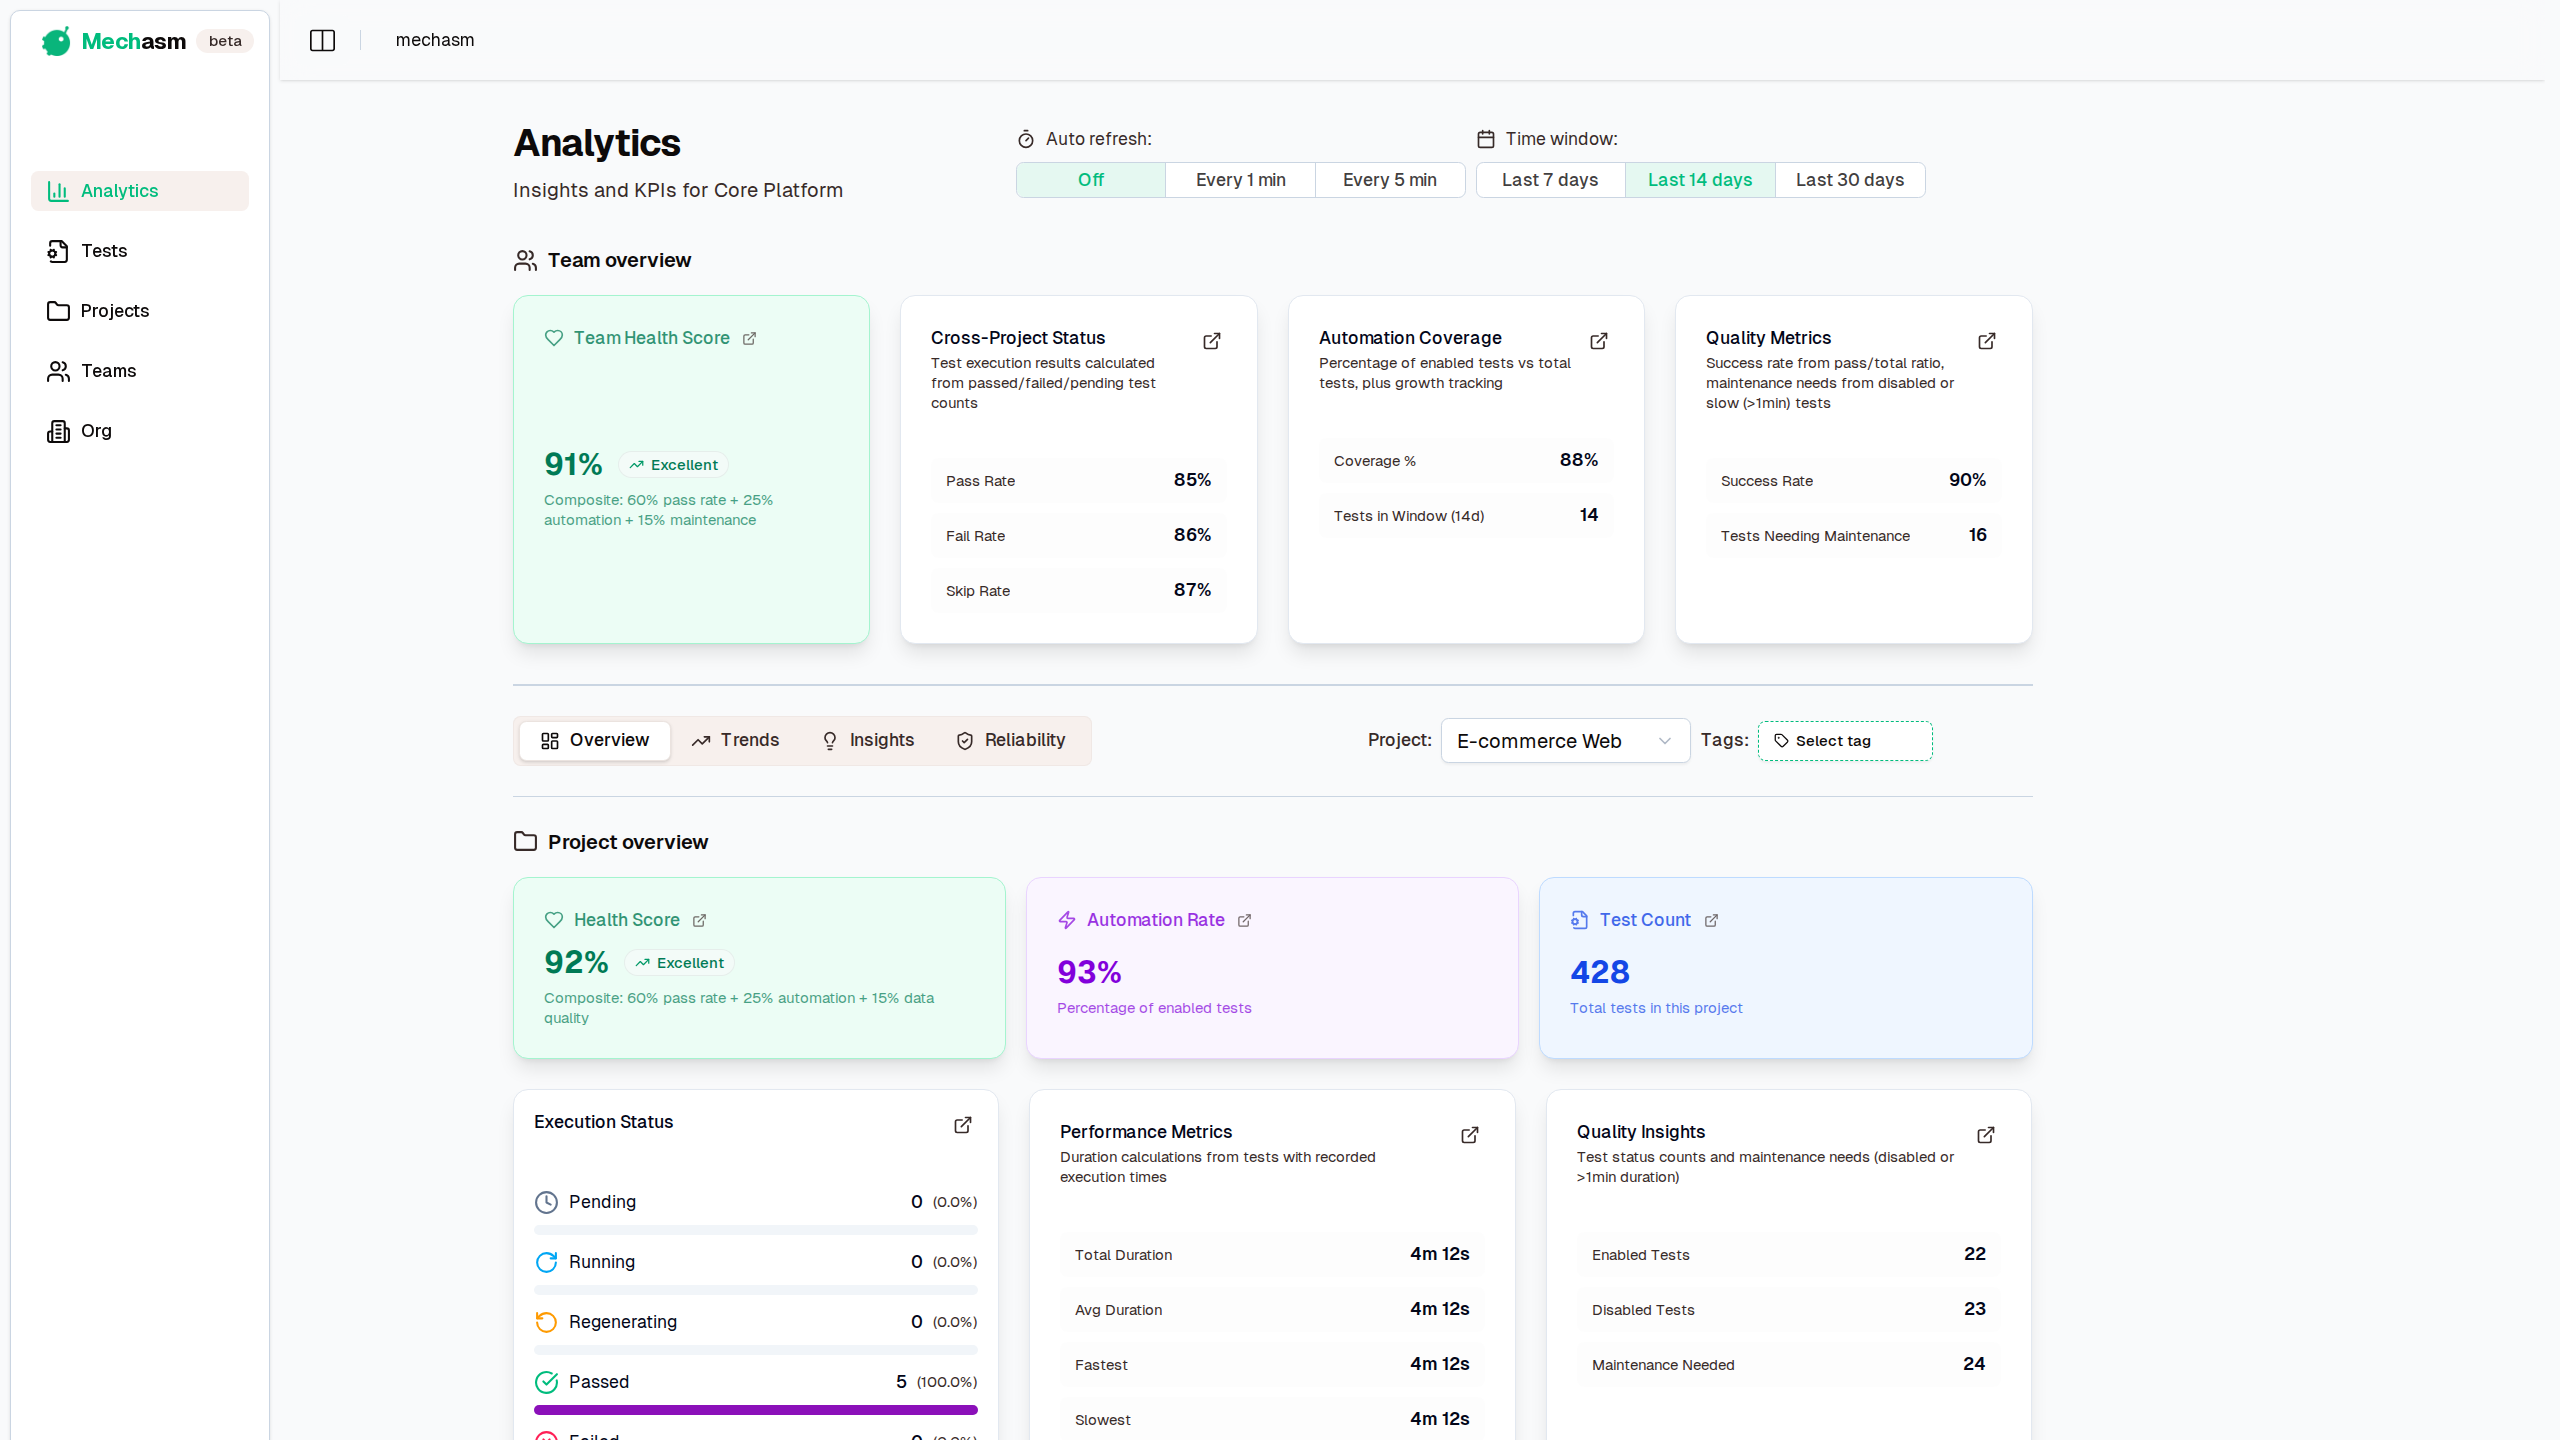
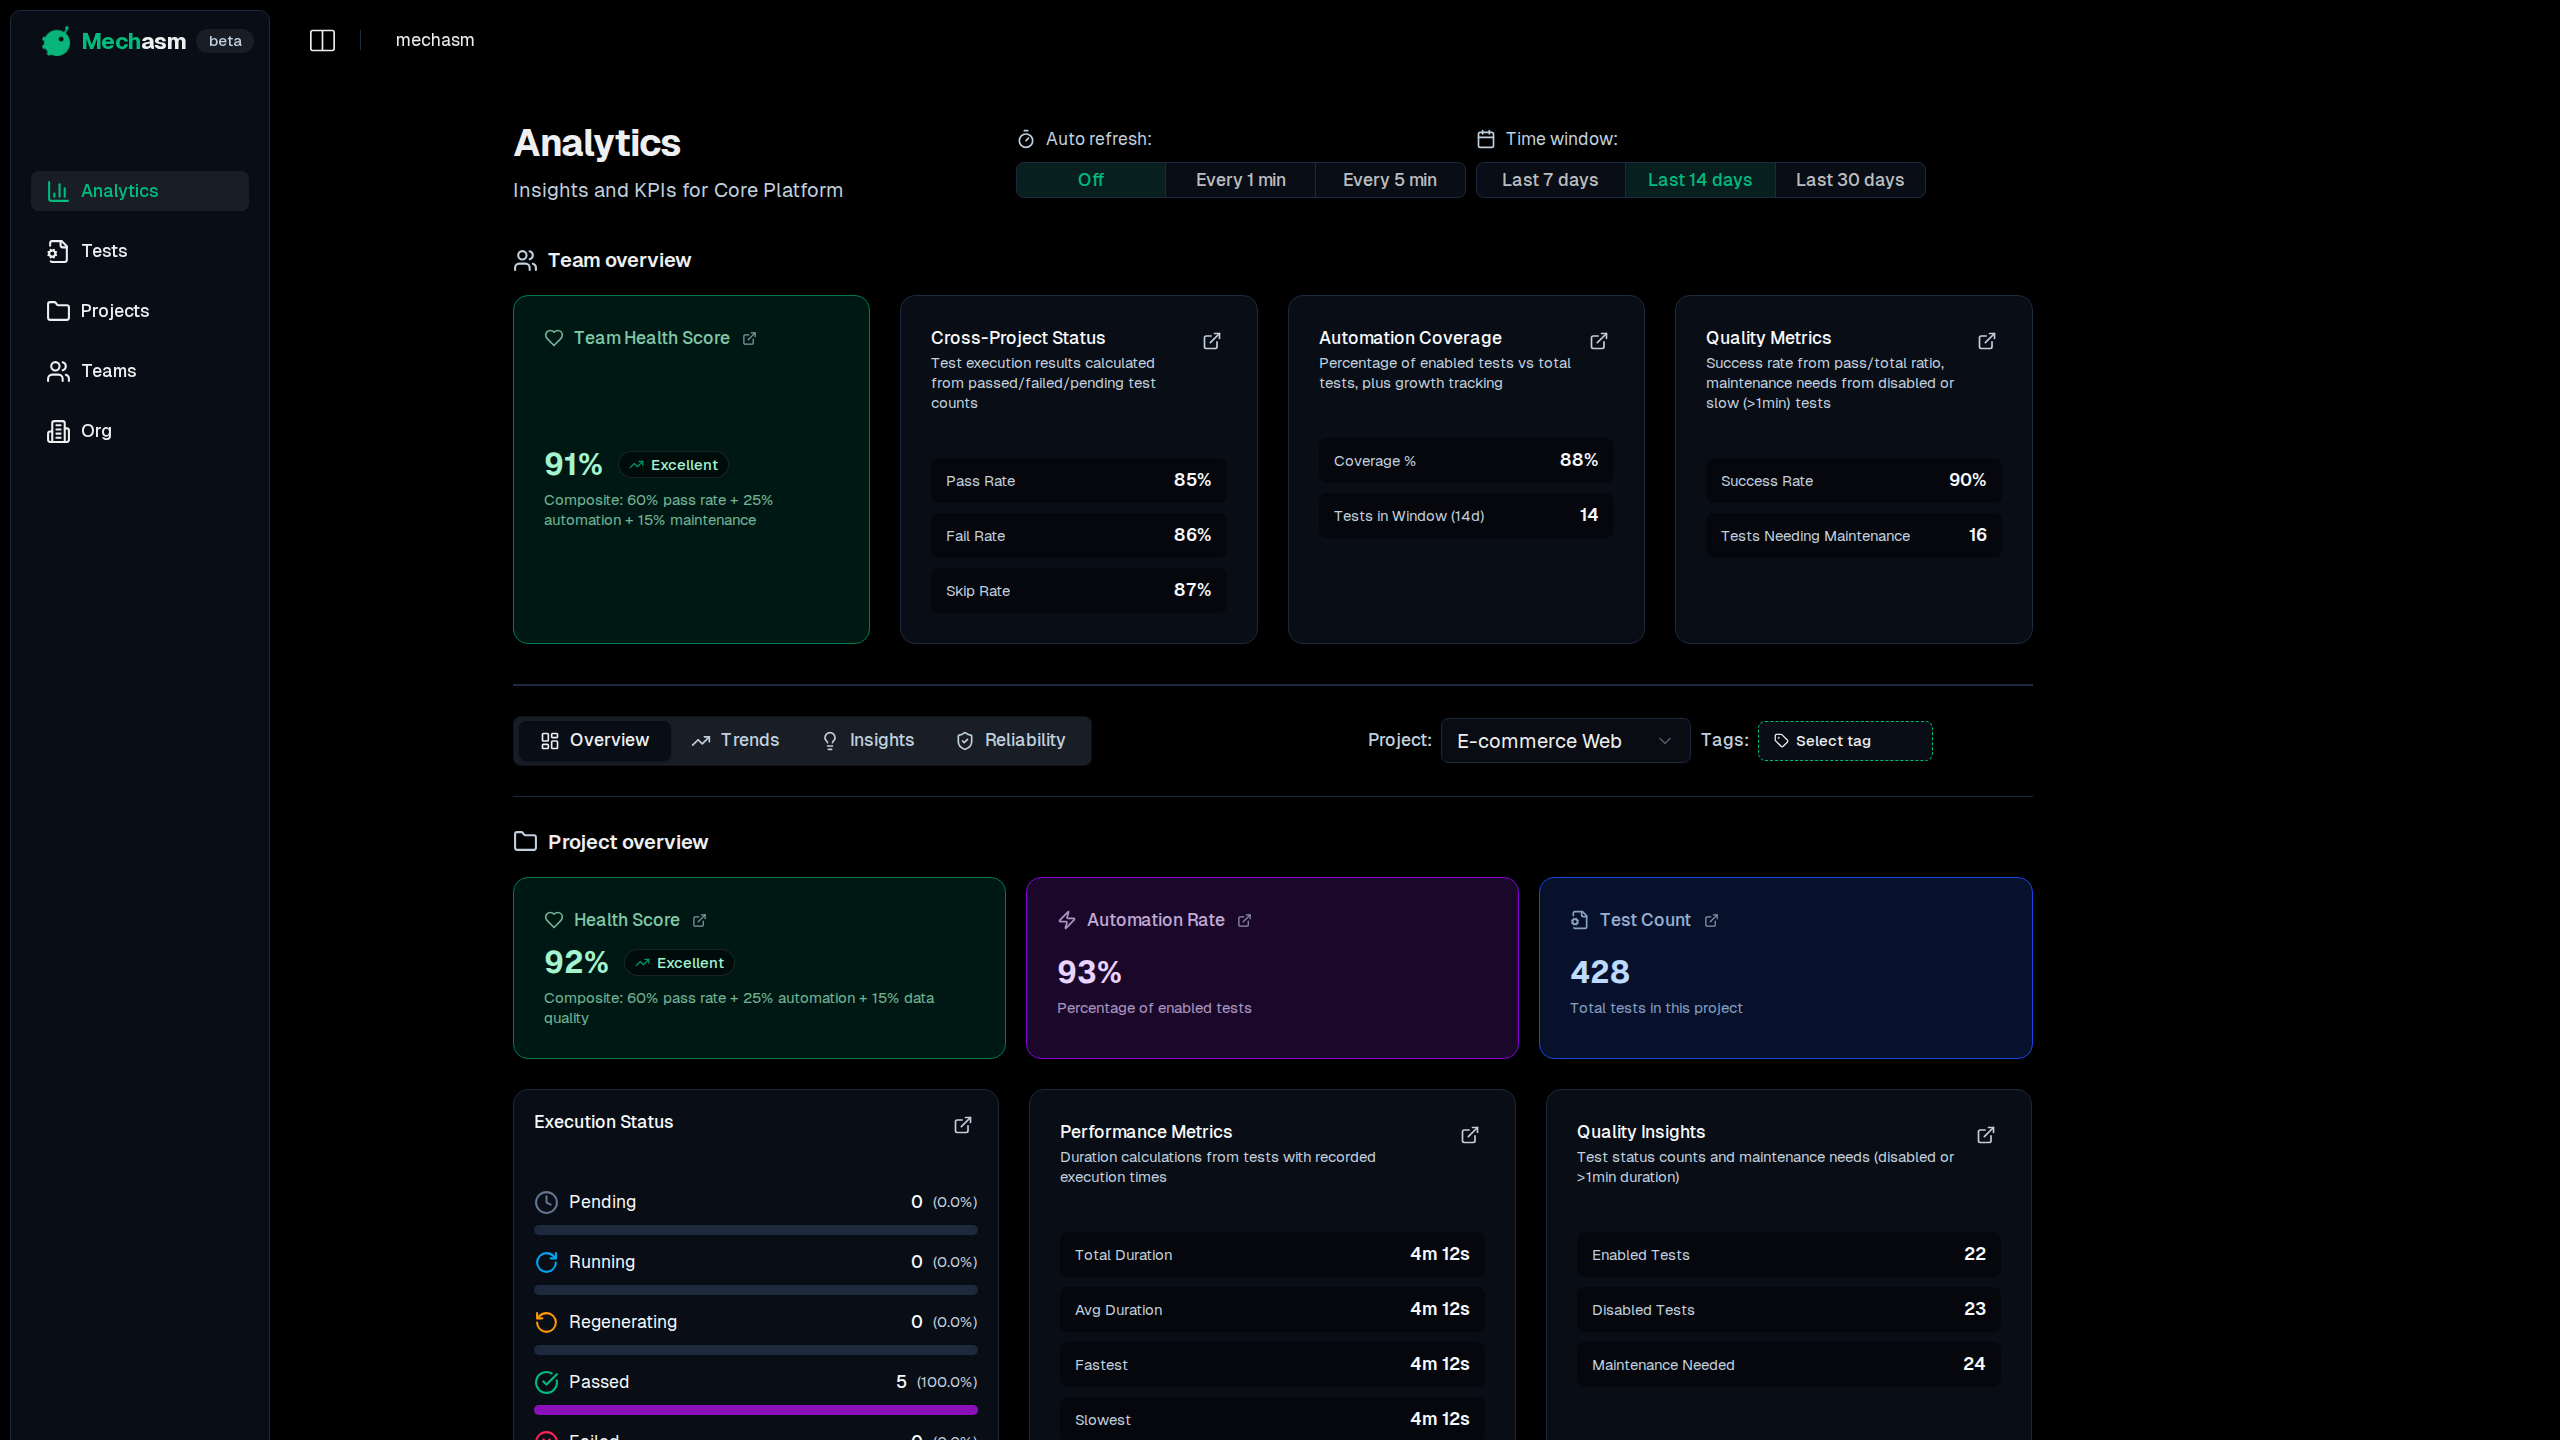
The Analytics Dashboard provides a centralized view of your testing velocity, reliability, and health.
Overview
The Analytics section is organized into four main levels, each providing increasingly detailed insights into your testing ecosystem:
Team Overview
High-level metrics showing overall team health, test enablement, and quality trends aggregated across all projects in the selected team.
Key Metrics:
- Team Health Score: Overall team performance based on pass rates across all projects
- Cross-Project Status: Pass/Fail/Skip rates aggregated from all team projects
- Test Enablement: True team-wide calculation (enabled tests / total tests) across all projects
- Quality Metrics: Success rate and tests needing maintenance
Project Overview
Detailed project-level analytics including execution status, performance metrics, and maintenance insights. All values are scoped strictly to the selected project.
Key Sections:
- Health Score: Project-specific pass rate calculation
- Enablement Rate: Percentage of enabled tests in the project
- Test Count: Total tests in the selected project
- Execution Status: Real-time status distribution (pending, running, regenerating, passed, failed)
- Performance Metrics: Duration analysis including total, average, fastest, and slowest execution times
- Quality Insights: Enabled/disabled test counts and maintenance needs
Advanced Metrics:
- Latest Run Insights: Median (p50) and P95 duration, Median/Mean ratio, Hanging runs (>10 minutes)
- Freshness & Quality: Stale tests (>14 days), Latest error rate, Failed steps/regressions, Median recency
Tests Trend
Visual time series showing daily counts of updated and newly created tests for the selected preset or custom range. Use it to monitor authoring velocity and maintenance activity over time.
- Respects the global time window selector at the top of the Analytics page
- Dual-series chart: Updated vs New tests, with legend toggles for visibility
- Learn more: Tests Trend
Test Insights
Tag-based filtering and analysis for project-level KPIs. When you apply tags (for example @smoke, @critical, @regression), all Test Insights metrics and charts are recalculated over only the tagged tests. With no tags selected, metrics are project-wide.
Key Features:
- Test Count: Counts tests within the current tag scope (or all tests when no tags are selected)
- Pass Rate: Success rate computed from tests in the current scope
- Test Enablement: Enabled/disabled test ratios within the current scope
- Test Health: Flakiness rate and quality scoring for the scoped set of tests
- Test Execution: Stability metrics and active test monitoring at project level
Top Lists & Advanced Analytics
Top Lists Section:
- Top 5 slowest tests
- Top 5 flakiest tests
- Top 5 most failing tests
Reliability Metrics:
- Retry & Quarantine analysis
- Environment breakdown
- Data quality assessment with missing duration/timestamp impact
Key Features
Time Window Filtering
Select a 7, 14, or 30-day preset, or choose a custom inclusive range up to 366 days (default 14 days). Calendar markers identify days with test runs; use Apply to update the dashboard.
Real-Time Data
All metrics are calculated from live data using your existing test results, project configurations, and execution history. No hardcoded values or estimates.
Consistent KPI Calculation
Important:
- Team Overview metrics are always team-wide and are never affected by tags.
- Project-level metrics (Overview, Trends, Insights, Reliability, Top Lists) are tag-aware: when tags are applied in the Analytics header, KPIs and charts are calculated only over tagged tests. With no tags, they are project-wide.
Health Scoring
Automated health scores based on pass rates with color-coded indicators: Green (80%+), Amber (60%+), Red (<60%) for quick visual assessment.
Maintenance Detection
Smart identification of tests needing attention based on disabled status or execution time patterns.
Auto Refresh
Keep your dashboard live with automatic refresh intervals.
- Options: Off, Every 1 min, Every 5 min
- Location: Compact dropdown beside the period picker
- Persistence: Saved to your browser (localStorage) per user
- Behavior: Uses live data; avoids refetching when the tab is hidden to save resources
Getting Started
-
Navigate to Analytics: Access the Analytics section from your dashboard sidebar.
-
Select Team & Project: Choose your default team and project to populate the dashboard with relevant data.
-
Set Time Window: Choose a preset or custom date range, then select Apply. Presets remain rolling and recalculate on every refresh; custom ranges remain fixed until changed.
-
Filter by Tags (Optional): Use the tag selector in Test Insights to focus display on specific test subsets like @smoke, @critical, or @regression.
-
Analyze Insights: Review the hierarchical KPIs to identify trends, issues, and opportunities for improvement.
Understanding the Hierarchy
The Analytics dashboard follows a top-down approach:
- Team Level: Broad organizational metrics and health indicators across all team projects
- Project Level: Specific project performance, execution details, and advanced run insights
- Test Level: Granular insights with tag-based display filtering (KPIs remain project-wide)
- Analytics Level: Top performers and reliability metrics
Each level builds upon the previous one, allowing you to drill down from high-level trends to specific actionable insights while maintaining consistent KPI calculations.
Next Steps
- Learn about Understanding KPIs to master each metric
- Explore Tag-Based Filtering for focused analysis
- Review the Tests Trend to track authoring and maintenance velocity (dual-series: Updated and New with visibility toggles)
- Review your team’s health scores and identify improvement opportunities