Note: To capture traces, you must enable Trace Recording in your Project Settings under the Assets Settings tab.
The Trace Viewer provides a comprehensive debugging experience for your test runs. It captures every action, screenshot, and DOM state during test execution, allowing you to inspect exactly what happened at each step.
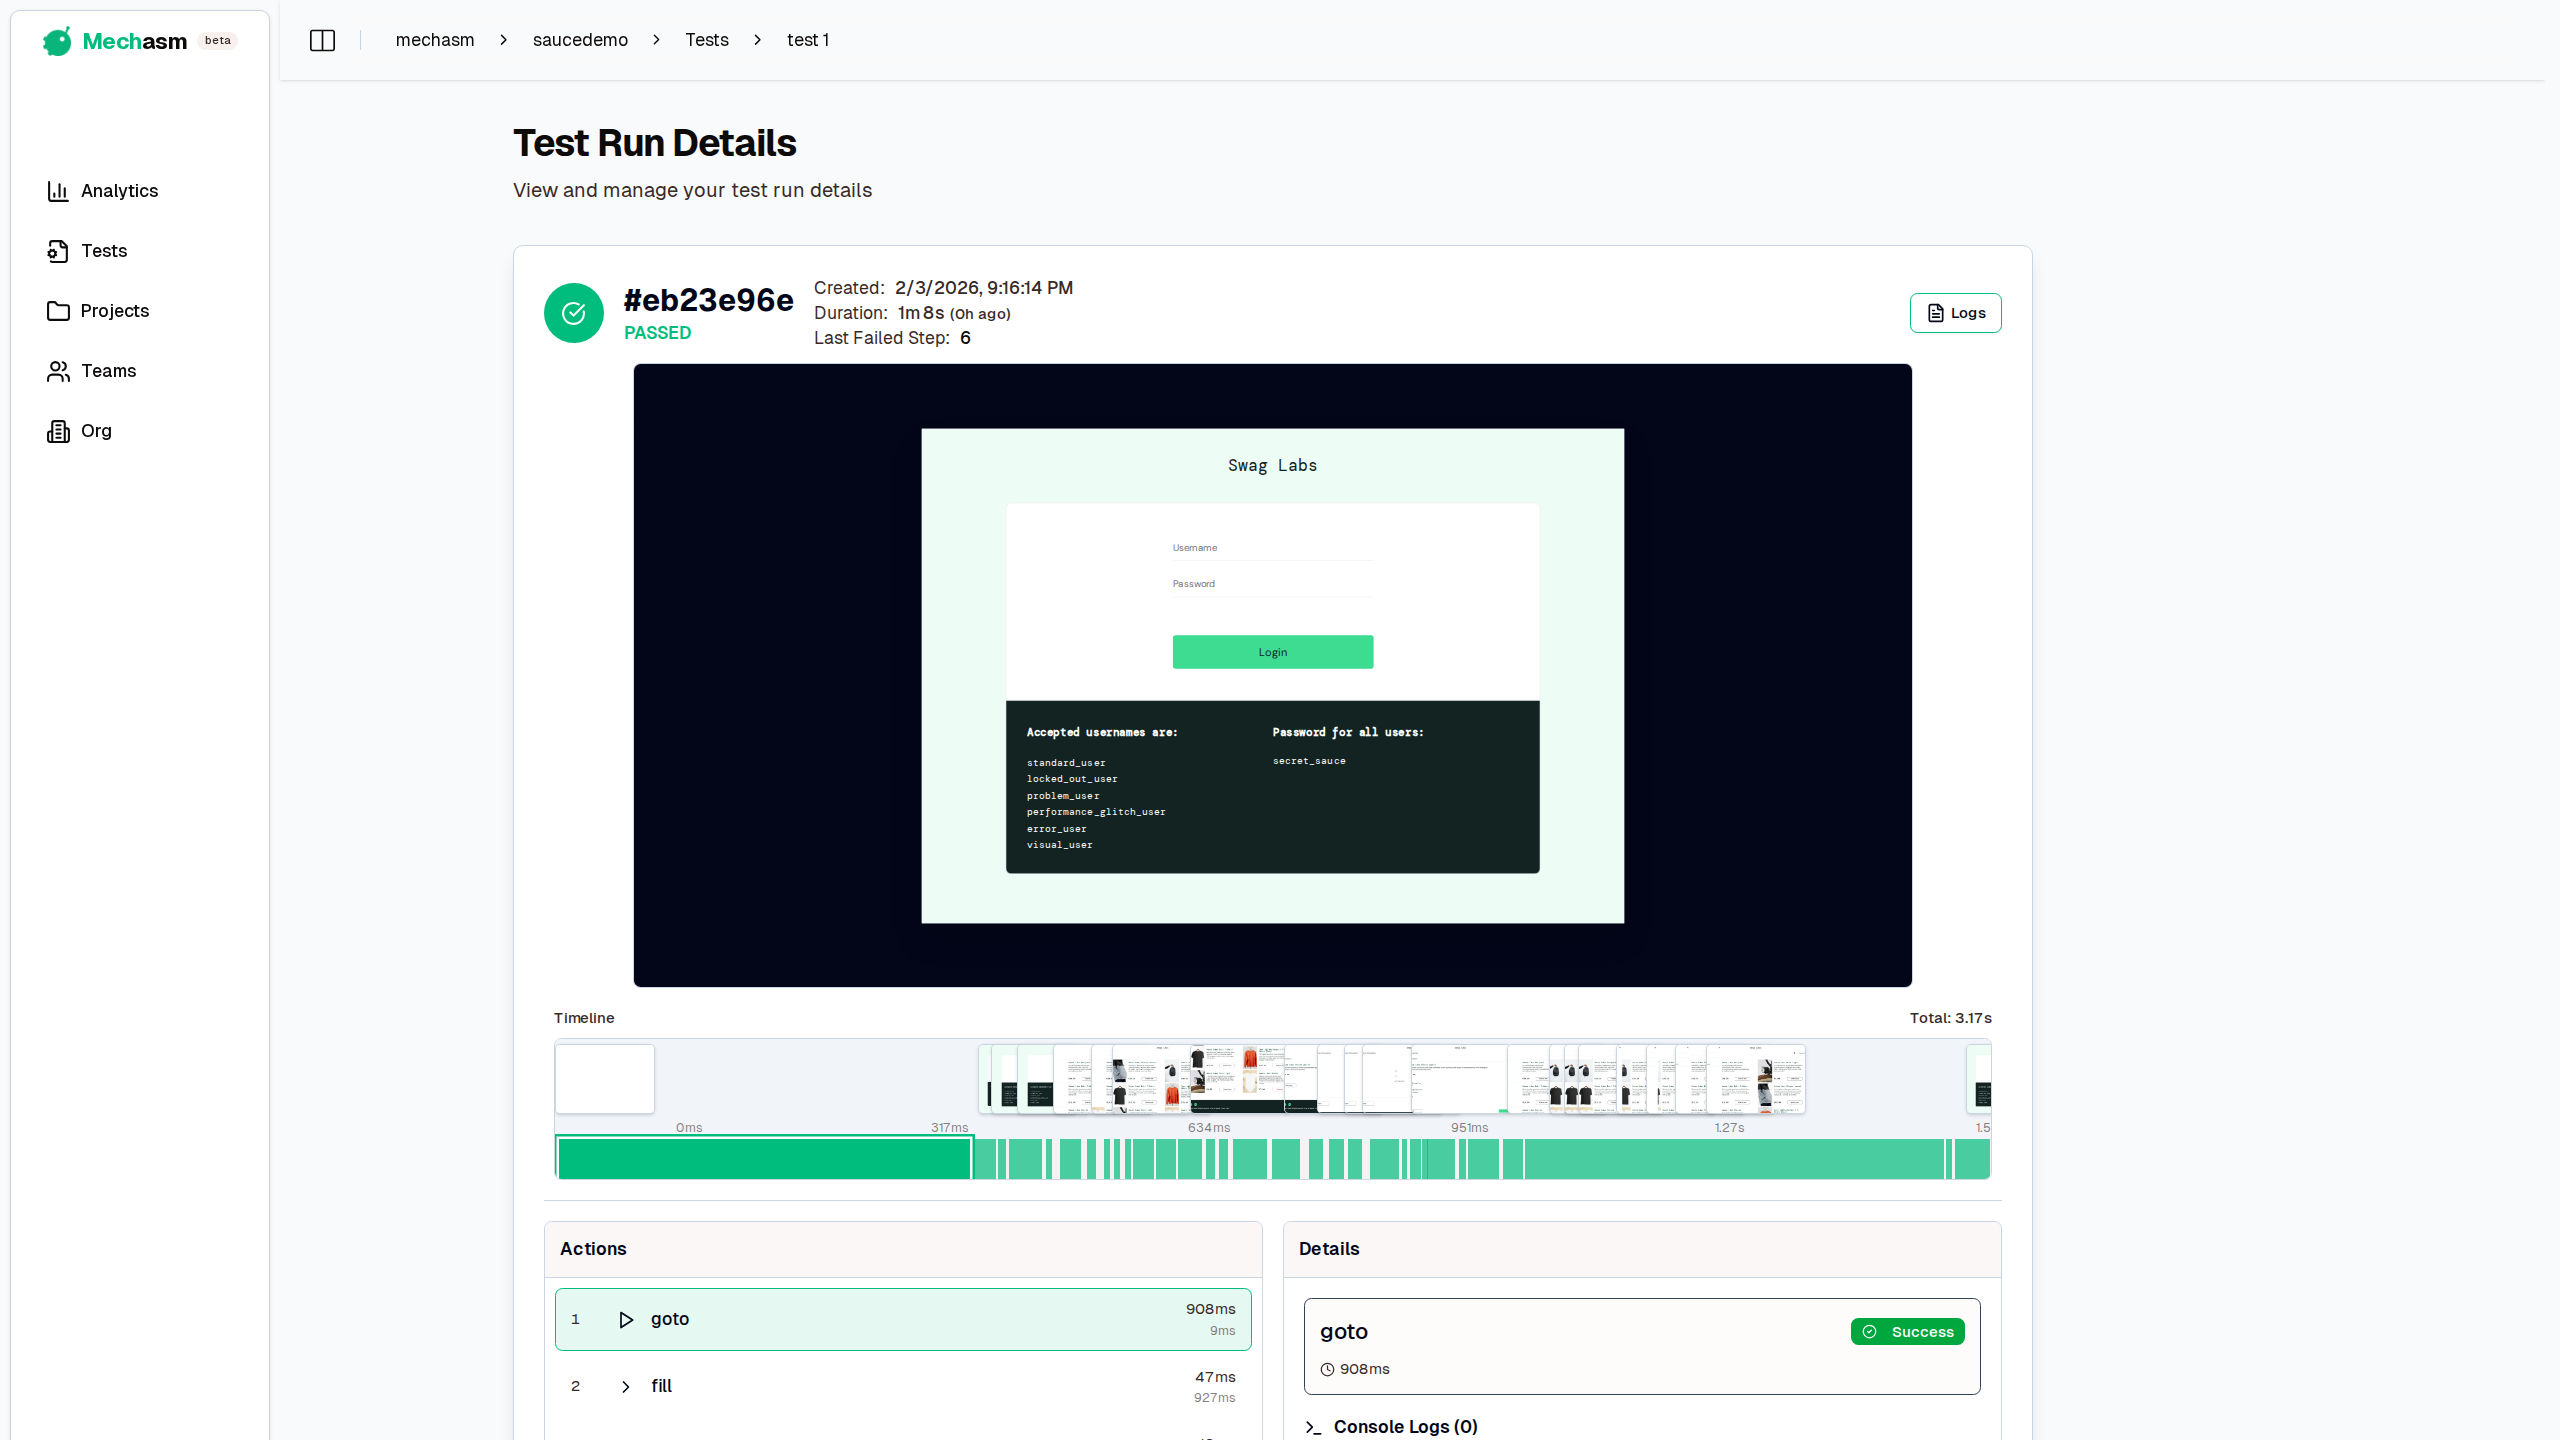
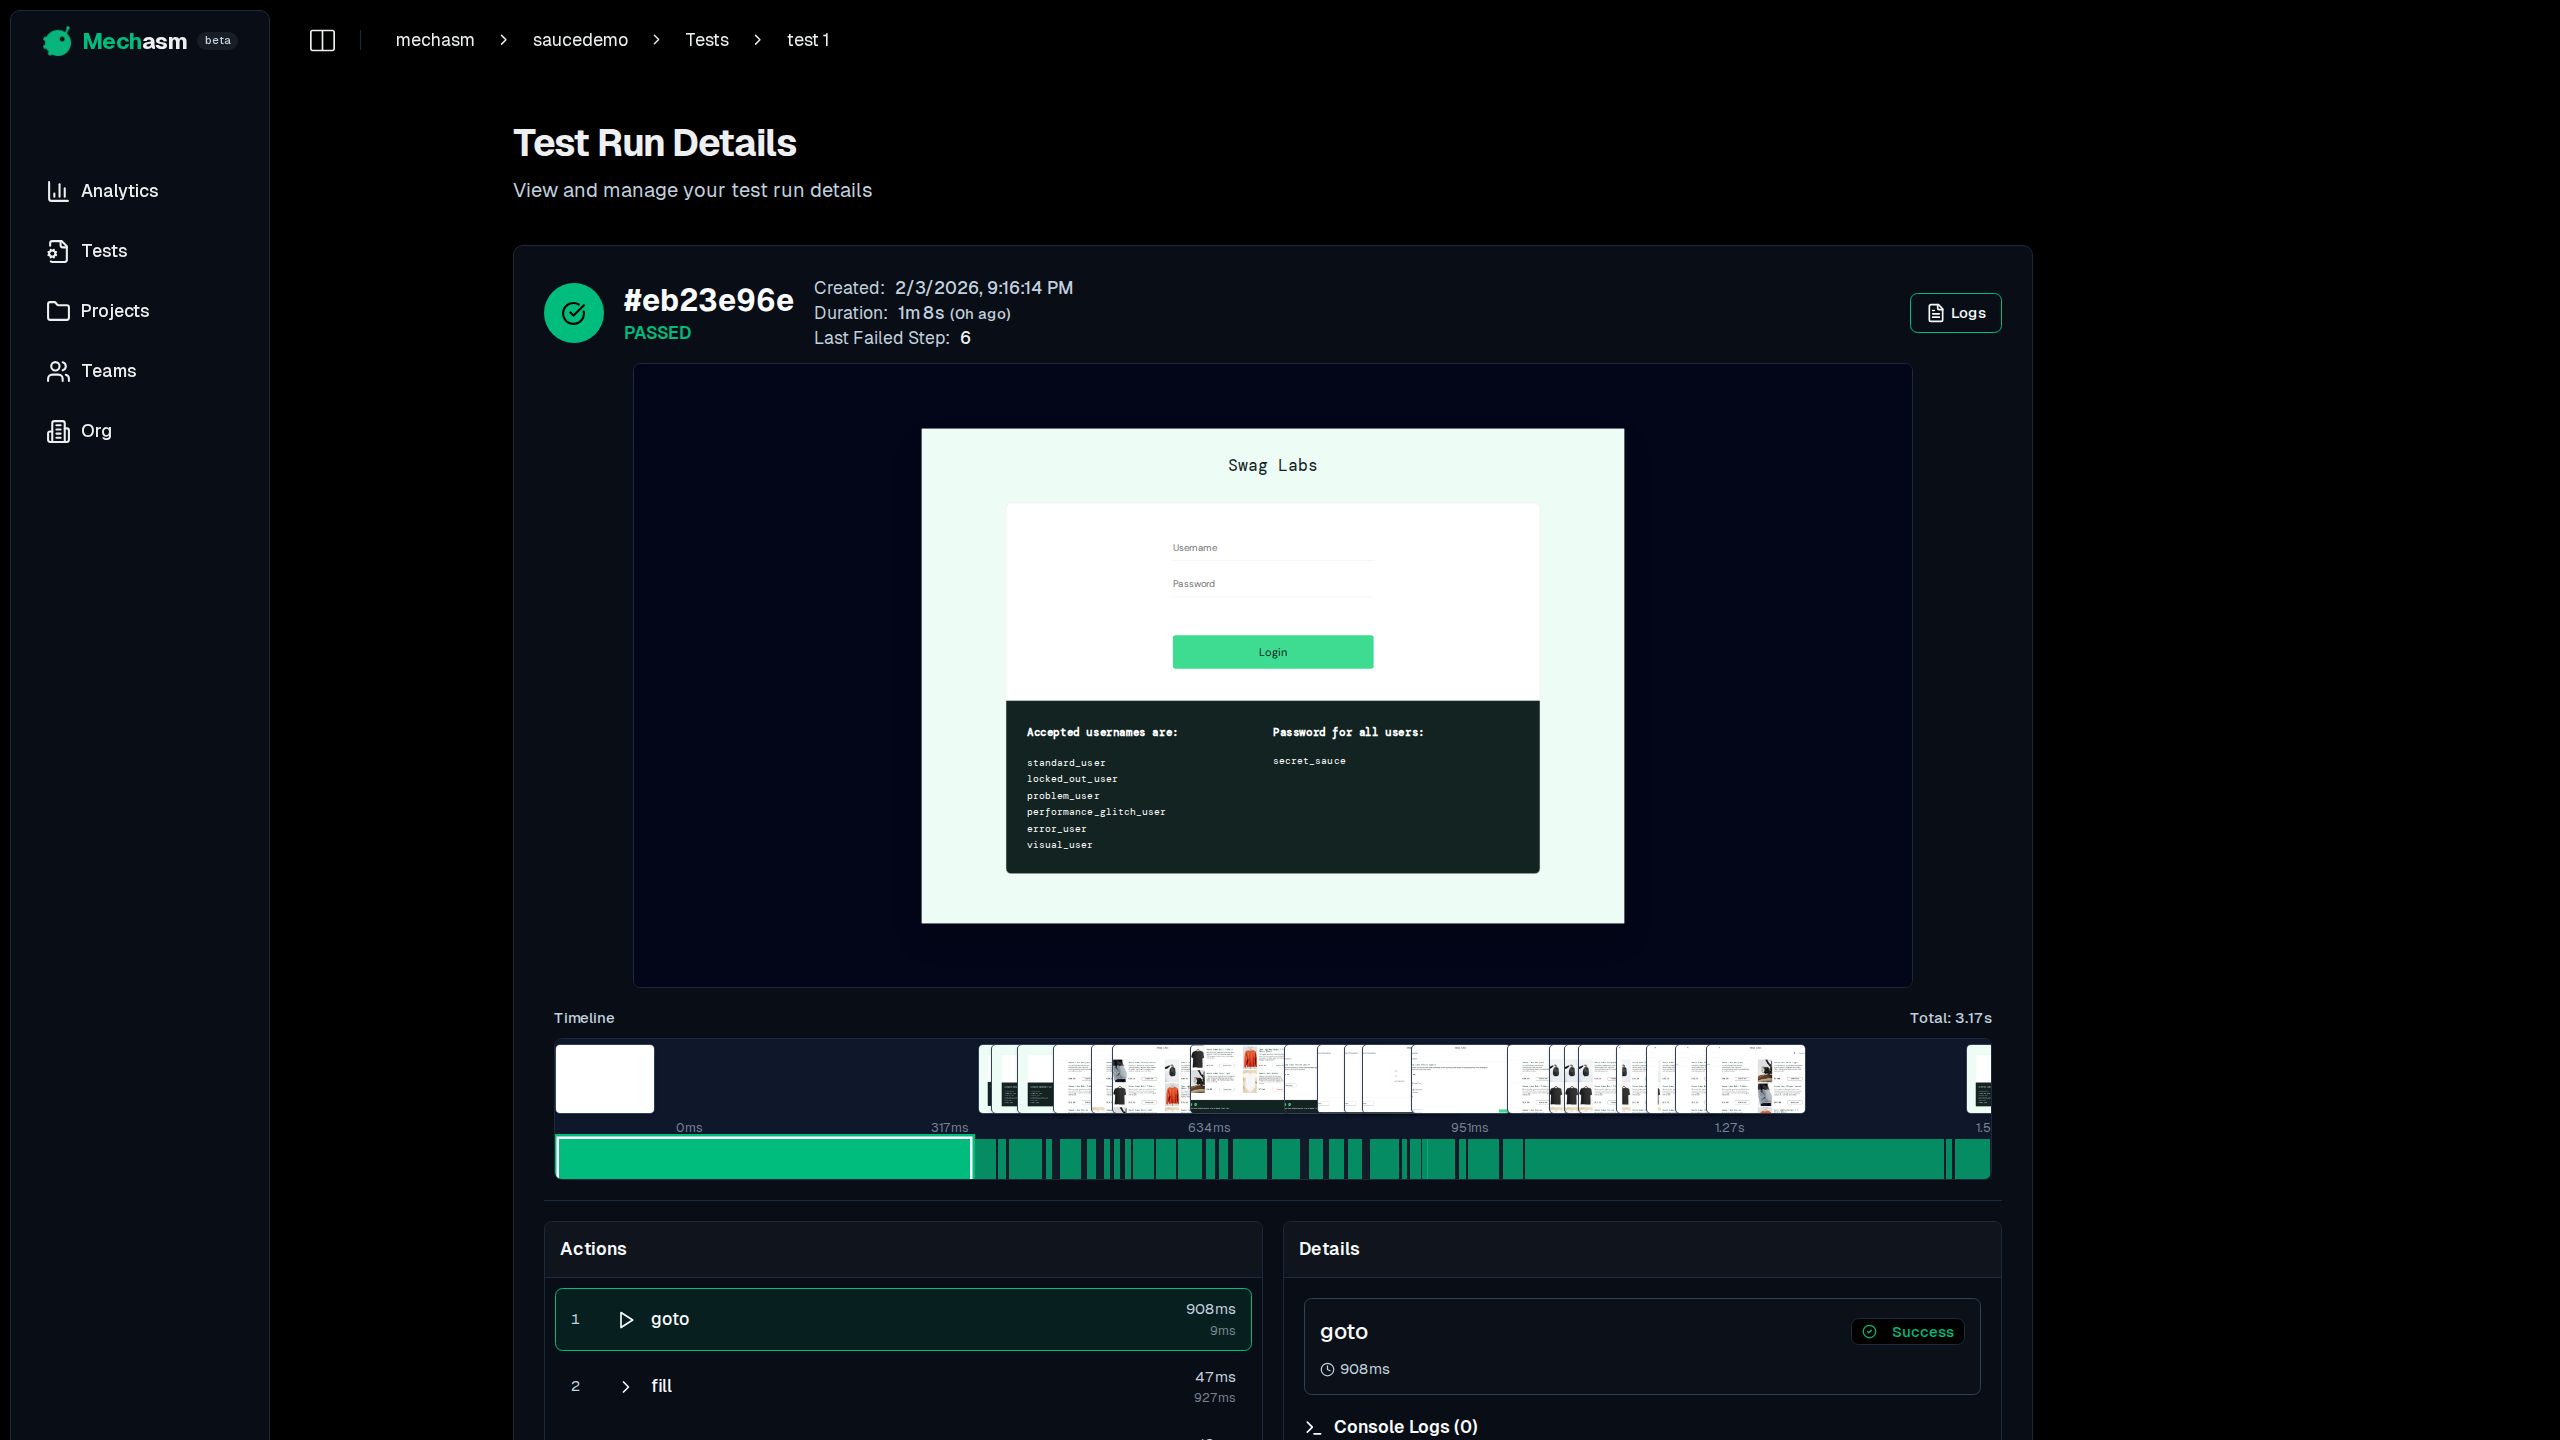
Timeline & Filmstrip
The timeline shows a visual representation of your test execution with:
- Filmstrip Thumbnails: Screenshots captured throughout the test, displayed as a continuous strip above the timeline
- Action Bars: Visual indicators showing when each action occurred and how long it took
- Synchronized Navigation: Click any thumbnail or action bar to jump to that moment in the test


All timeline elements are synchronized - clicking a screenshot thumbnail automatically selects the corresponding action in the list, and vice versa.
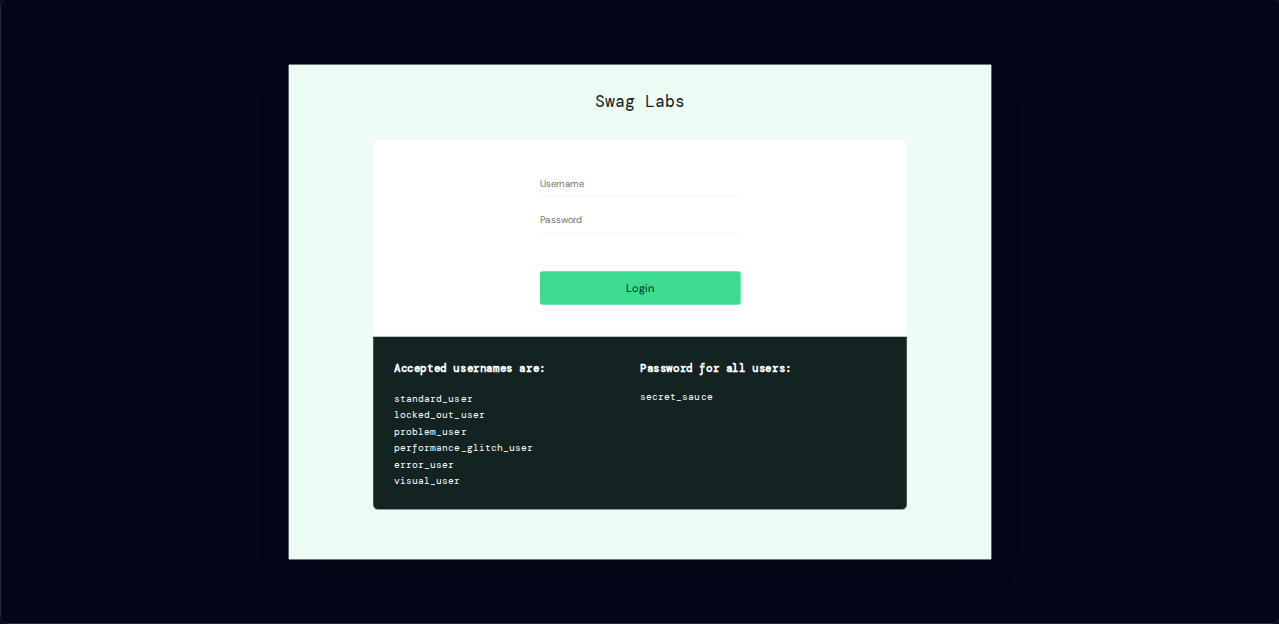
DOM Snapshot Viewer
The snapshot viewer displays the exact DOM state at each action:
- Interactive Preview: See the page as it appeared during the test
- Fullscreen Mode: Expand the snapshot for detailed inspection
- Screenshot Fallback: When DOM snapshots aren't available, the viewer automatically shows the closest screenshot

Action Details
The action panel provides detailed information about each step:
- Action Type: The action that was executed (click, fill, navigate, etc.)
- Selector: The element selector used for the action
- Duration: How long the action took to complete
- Status: Success or failure indicator
- Error Messages: Full error details for failed actions
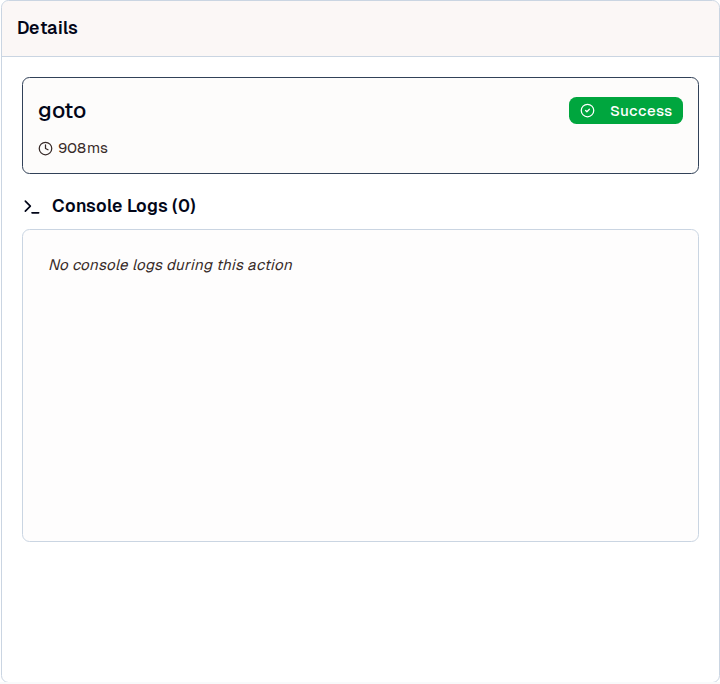
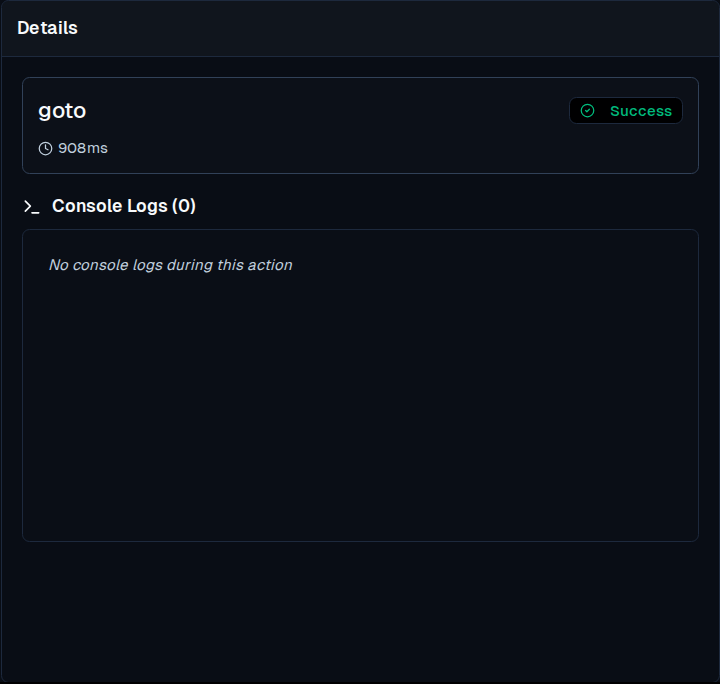
Console Logs
View browser console output filtered by action:
- Timestamped Logs: See exactly when each log message occurred
- Error Highlighting: Errors and warnings are color-coded for quick identification
- Action Context: Logs are filtered to show only messages from the selected action's timeframe
This makes it easy to correlate console output with specific test steps, helping you identify issues faster.
Best Practices
- Use the Timeline: Click filmstrip thumbnails to quickly navigate to specific moments
- Check Console Logs: Many issues reveal themselves in console errors
- Inspect Snapshots: DOM snapshots show the exact state, including dynamic content
- Review Failed Actions: Error messages in the action details panel pinpoint exactly what went wrong